

The Challenges
Pneumonia is an inflammatory condition of the lung affecting primarily the small air sacs known as alveoli. Typically symptoms include some combination of productive or dry cough, chest pain, fever, and trouble breathing. Severity is variable. Pneumonia is usually caused by infection with viruses or bacteria and less commonly by other microorganisms, certain medications and conditions such as autoimmune diseases. Risk factors include cystic fibrosis, chronic obstructive pulmonary disease (COPD), asthma, diabetes, heart failure, a history of smoking, a poor ability to cough such as following a stroke, and a weak immune system. Diagnosis is often based on the symptoms and physical examination. Chest X-ray, blood tests, and culture of the sputum may help confirm the diagnosis. The disease may be classified by where it was acquired with community, hospital, or healthcare-associated pneumonia. Pneumonia affects approximately 450 million people globally (7% of the population) and results in about four million deaths per year.
Opportunity
In order to detect the presence of Pneumonia using Chest X-rays, we applied predictive modelling. Our dataset consists of more than 5000 Chest X-Ray images, Normal images are around 1341 and Pneumonia images are around 3875. Our dataset is imbalanced towards Pneumonia class. Chest X-Ray image from our dataset looks like this –
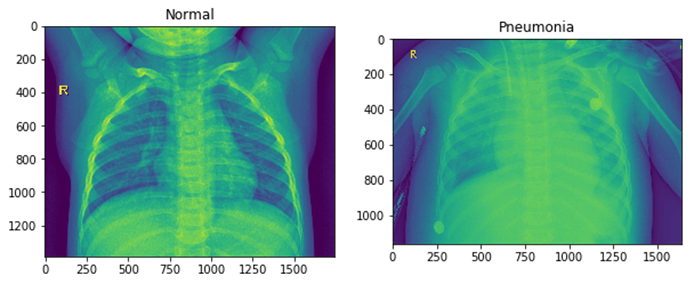
In the above image we can see Normal Chest X-Ray image and on the left, we can see the pneumonia Chest X-Ray image.
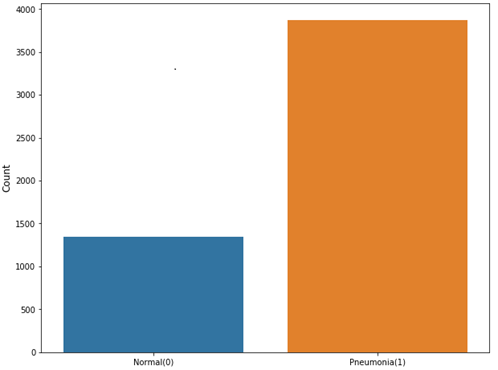
As you can see the data is highly imbalanced. We have almost with thrice pneumonia cases here as compared to the normal cases. This situation is very normal when it comes to medical data. The data will always be imbalanced, either there will be too many normal cases, or there will be too many cases with the disease.
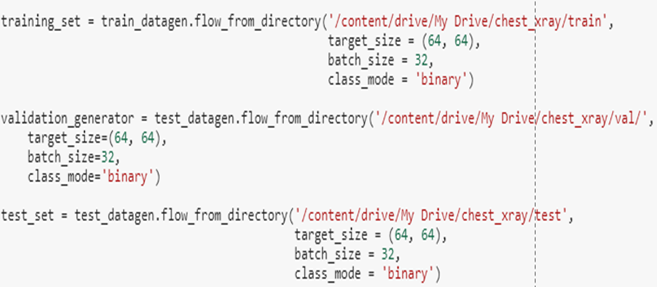
Next step is to separate our dataset into training set,test set and validation set.
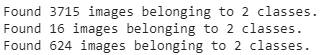
As in the above image, we have separated 3715 images into training set, 16 images with two classes(Pneumonia and normal) and 624 testing set images.
After this, we will be rescaling our images and change their shape in 64*64 pixels.
We will be using CNN(Convolutional Neural Network) for this Chest X-ray image dataset.
A Convolutional Neural Network is a special type of an Artificial Intelligence implementation which uses a special mathematical matrix manipulation called the convolution operation to process data from the images.
- A convolution does this by multiplying two matrices and yielding a third, smaller matrix.
- The Network takes an input image and uses a filter (or kernel) to create a feature map describing the image.
- In the convolution operation, we take a filter (usually 2×2 or 3×3 matrix ) and slide it over the image matrix. The corresponding numbers in both matrices are multiplied and added to yield a single number describing that input space. This process is repeated all over the image.This can be seen in the following animation.
- We use different filters to pass over our inputs and take all the feature maps, put them together as the final output of the convolutional layer.
- We then pass the output of this layer through a non-linear activation function. The most commonly used one is ReLU.
- The next step of our process involves further reducing the dimensionality of the data which will lower the computation power required for training this model. This is achieved by using a Pooling Layer. The most commonly used one is max pooling which takes the maximum value in the window created by a filter. This significantly reduces training time and preserves significant information.
Below is an example of convolution neural network architecture –
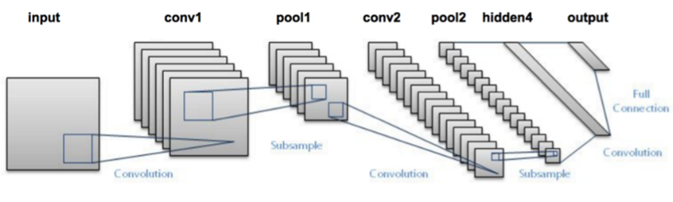
Moving on to building a convolutional neural network, our model will be sequential, and we will be using totally two layers of CONV2d and max-pooling layers respectively to it.
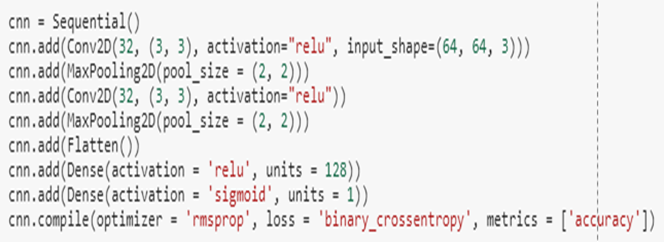
On the first layer ,we will be giving input size as we changed as 64*64, and the activation function is Rectified linear unit.
Filter size(3,3)
Number of filters – 32
Max pooling size (2,2)
We will have the same for the next few layers too as before, then at last sigmoid function is used .
Optimizer used here is – ‘RMSPROP.’
Loss – binary_crossentropy
Metrics – ‘Accuracy’
Activation –
- The rule for CNN layers
- Sigmoid for the final layer(As our model is binary class output)
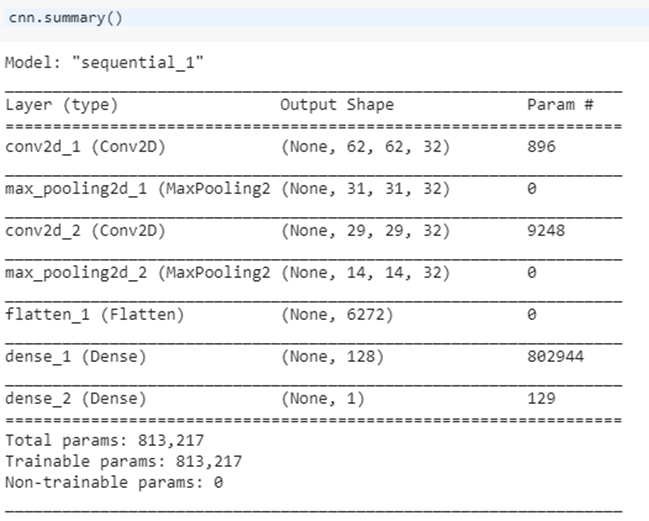
CNN Summary:
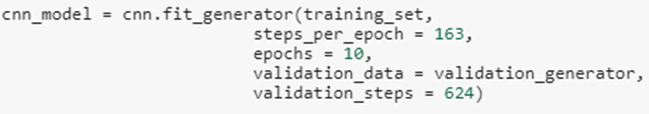
CNN fit generator:
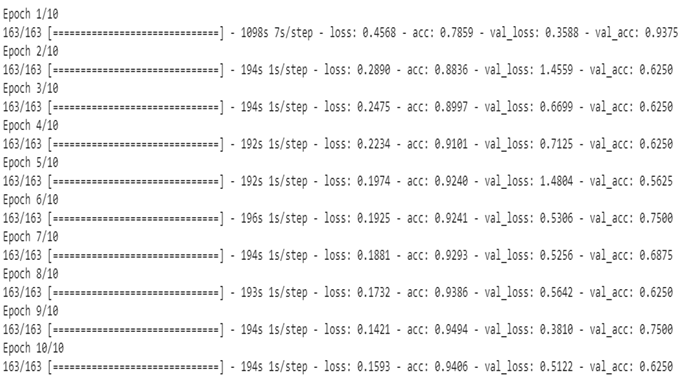
Cnn model will fit with the training_set and epochs will be 10 , then for the validation set validation generator is used. Steps per epochs are 163, and the validation steps are 624. Code for the fit generator is given below.
After running a fit generator, our model starts training –
Test Accuracy:
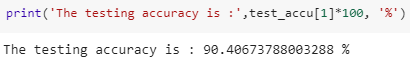
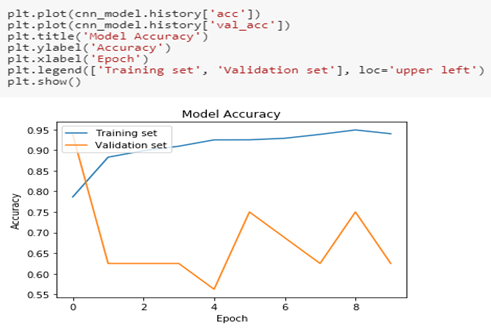
The test accuracy we got was 90%, we will now plot the graph of training and validation through epochs.
Other models tried:
- With more cnn layers and added dropout gave some more accuracy and did not overfit the data.
- We used different Optimizer such as ADAM and ADAGRAD, to check we can achieve better accuracy.
- We have also tried tweaking each parameters of different layers , tried dropout methods again, used different Epochs and batch normalization.
Why Guires
- Guires Data analytics mission is to democratize AI for healthcare industries. The team of data science expert use the power of AI to solve business and social challenges. We are a pioneer in the research field for more than fifteen years and offer end to end solution for the firm to set the direction for the company and support analytical frameworks for better understanding and making strategic decisions. We provide appropriate solutions using your existing volume of data available in varying degree of complexities that cannot be processed using traditional technologies, processing methods, or any commercial off the shelf solutions. By outsourcing big data to us, we can analyze events that have happened within and outside an organization and correlate those to provide near accurate insights into what drove the outcome. Our big data analytics solutions are fast, scalable and possess flexible processing.
- We use powerful algorithms, business rules, and statistical models. We work with text, image, audio, video and machine data. Our medical experts understand the different layers of data being integrated and what granularity levels of integration can be completed to create the holistic picture. Our team creates the foundational structure for analytics and visualization of the data. Our data analytics team is well equipped with advanced mathematical degrees, statisticians with multiple specialist degrees who can apply cutting-edge data mining techniques thereby enabling our clients to gain rich insights into existing customers and unearth high potential prospects.


Comment here