

The Challenges
Patients with the Liver disease have been continuously increasing because of excessive consumption of alcohol, inhale of harmful gases, intake of contaminated food, pickles and drugs. There are many kinds of liver diseases: Diseases caused by viruses, such as hepatitis A, hepatitis B, and hepatitis C, Diseases caused by drugs, poisons, or too much alcohol. Examples include fatty liver disease and cirrhosis, Liver cancer, Inherited diseases, such as hemochromatosis and Wilson disease. Obesity is also associated with liver damage. Over time, damage to the liver results in scarring (cirrhosis), which can lead to liver failure, a life-threatening condition. But how do we identify these patients? We can use predictive modelling from data science to help prioritize patients.
Opportunity
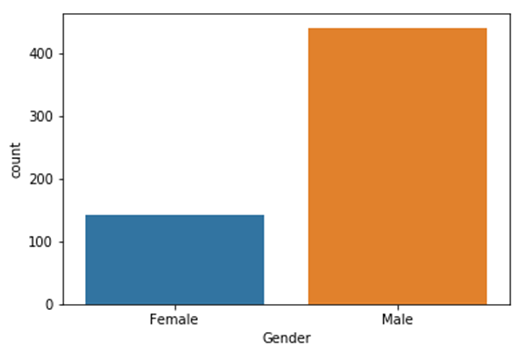
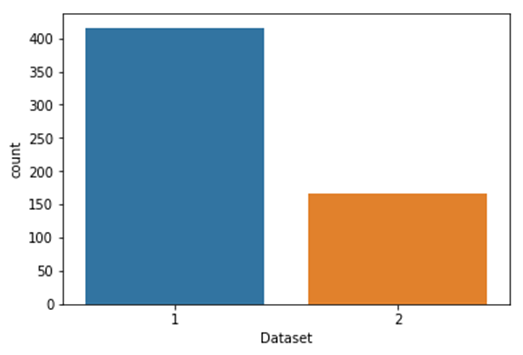
This dataset was used to evaluate prediction algorithms in an effort to reduce the burden on doctors. The objective is to predict if a patient is suffering from liver disease or not. Data which we had used is from UCI Machine learning repository. This data set contains 416 liver patient records and 167 non-liver patient records collected from North East of Andhra Pradesh, India. The “Dataset” column is a class label used to divide groups into liver patient (liver disease) or not (no disease). This data set contains 441 male patient records and 142 female patient records.
Columns:
- Age of the patient
- Gender of the patient
- Total Bilirubin
- Direct Bilirubin
- Alkaline Phosphatase
- Alamine Aminotransferase
- Aspartate Aminotransferase
- Total Proteins
- Albumin
- Albumin and Globulin Ratio
- Dataset: field used to split the data into two sets (patient with liver disease, or no disease)
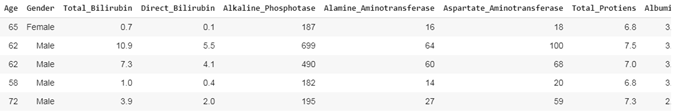
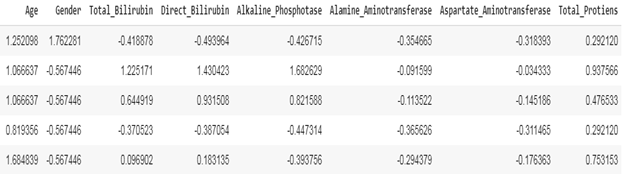
First, five rows of data look like this –
Gender distribution of this dataset is –
And our target class distribution is –
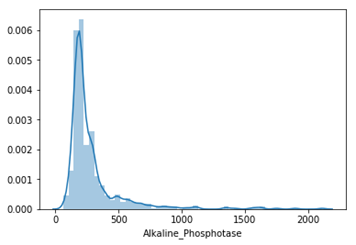
Let’s now dive deep into other features in the dataset,
Alkaline phosphate- mostly the features are between 0-500 range.
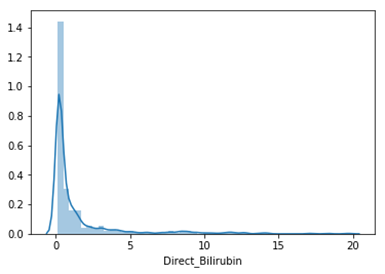
Direct_Bilirubin – this feature has more 0,1,2,3s
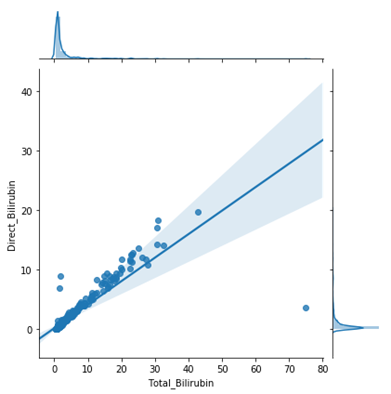
Now we will check multivariate analysis on Total_Bilirubin and Direct_Bilirubin – these features are plotted using seaborn in joint plot. We can see that they almost have a similar distribution.
Multivariate analysis on Alkaline_Phosphotase and Alamine_Aminotransferase-
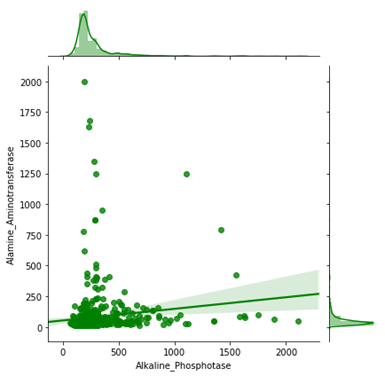
These features are not distributed normally, they are widespread across alkaline phosphate, and alphamine aminotransferase is mostly among 0-250 and few other outliers.
Now we will see protein and albumin with our output class
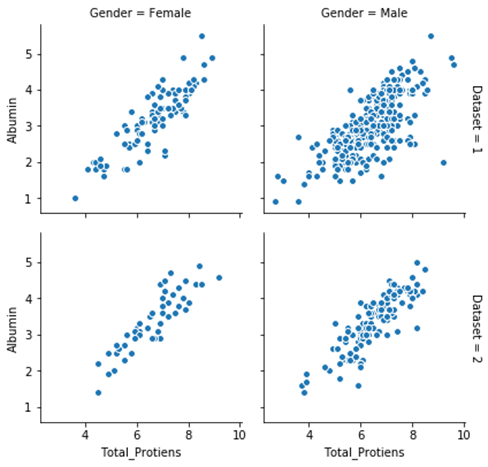
This is done using the factor plot from seaborn package in python. We can see that albumin in male with total proteins has the liver disease than female.
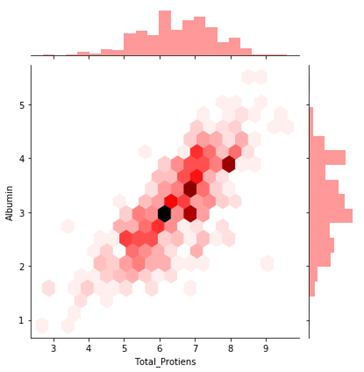
Total_Protiens and Albumin- Protein has mostly ranged from 5-9 and albumin mostly ranges from 2-5 , but together they correspond well towards correlation.
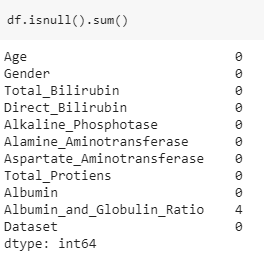
Null elements:
There are only 4 null elements in a single feature.
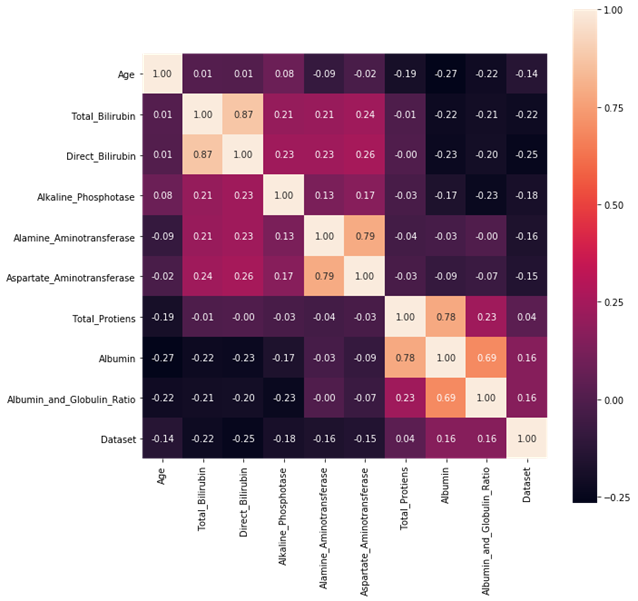
Let’s see the correlation between all the features to understand how close the features are –
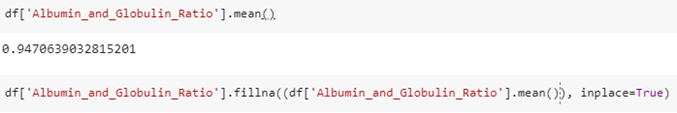
Removing null elements from the dataset-
Standardisation: this is an important step before modelling as the features are needed to be in a particular range. Consider this example, if feature age 50 and insulin 0.5 is fed into ML algorithm the machine thinks that age is more important as it has higher value. For this reason we need to normalize the dataset leaving out the target column. After completing this standardisation process the dataset looks like this-
We are doing this before visuals and modeling so that the features get normalize, and this is achieved by using Standard scalar. Below are the few lines of normalized features –
Predictive modelling:
We will be using different machine learning algorithms such as SVM(Support Vector Machine), Logistic Regression , Random Forest classifier, Decision tree, KNN(K- Nearest Neighbours) and MLP(Multilayer Perceptron).
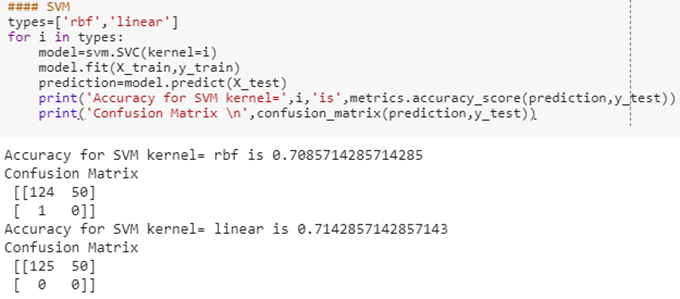
SVM: we will be using support vector machine from sklearn python package. There are two kernels in svm, namely Linear and RBF , we will be testing both the algorithms.
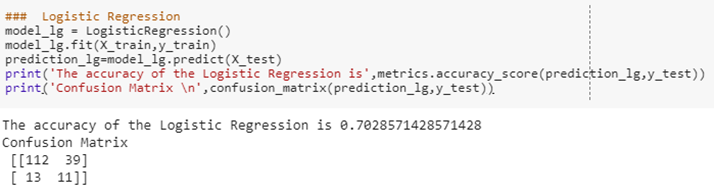
Logistic Regression: this algorithm is also from sklearn python package, here the main hyperparameters are C and Penalty(L1 or L2).
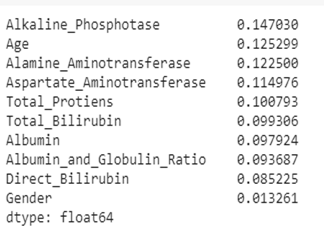
Random Forest: this algorithm is a type of ensemble model which works well for classification problems. Let us first find the important features and then predict the liver disease.
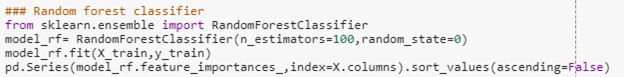
The important feature according random forests are-
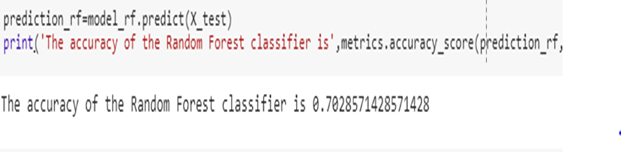
Let us see the accuracy of these features first-
KNN: K- nearest neighbour is a machine learning algorithm which uses distance metrics to find the closest neighbours of our features, we need to find the value of k to get the best accuracy at a particular value.
We will be testing with many numbers of k- neighbours,, so that we can find the best amount for k to achieve better accuracy.
For this dataset let’s set the value of k as 20.
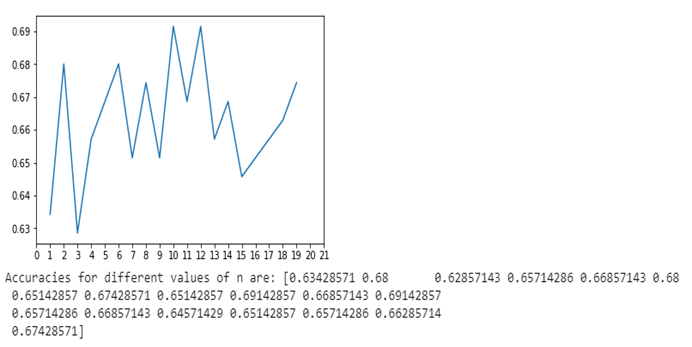
Accuracy does not seem to get higher than 66%, so we will stop with 20 nearest neighbours and 20 th value for k got 65%.
Adaboost classifier: Let us now try Ensemble model (which takes Decision tree classifier as its base algorithm and same hyperparameters as decision tree is set)
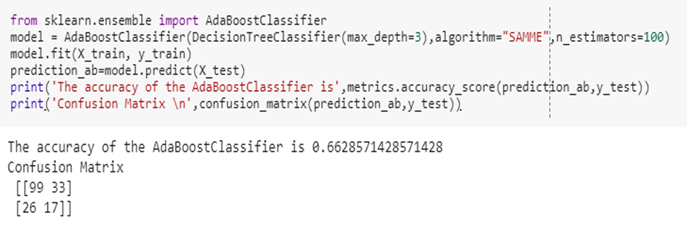
This model doesn’t get much accuracy than others.
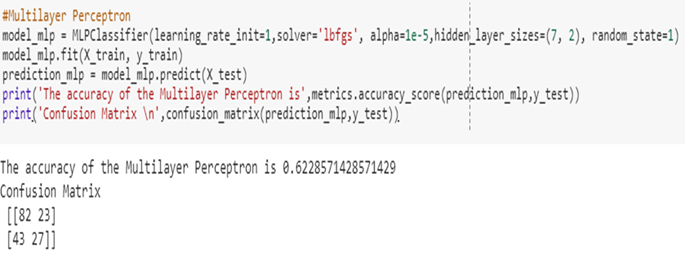
Next, we will be trying MULTI-LAYER PERCEPTRON -with different iteration of different layers and learning rate.
As most of the algorithms are not giving good accuracy lets, try out cross-validation with all the algorithms and also we will try out grid search evaluation method.
Cross-validation: Cross-validation is a resampling procedure used to evaluate machine learning models on a limited data sample.
The general procedure is as follows:
- Shuffle the dataset randomly.
- Split the dataset into k groups.
- For each unique group:
- Take the group as a holdout or test data set.
- Take the remaining groups as a training data set.
- Fit a model on the training set and evaluate it on the test set.
- Retain the evaluation score and discard the model.
- Summarize the skill of the model using the sample of model evaluation scores.
Now we will be using this cross-validation for our algorithms and check which gives us better accuracy – let K be 10
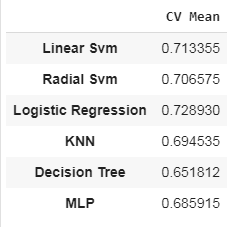
We can see that linear SVM performed well than other algorithms , let us also try out the grid search cv.
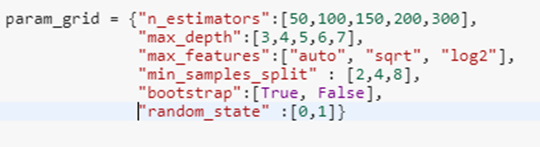
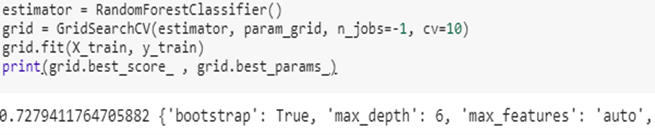
These will be the parameters of the random forest which we will be using on Random forest classifier.
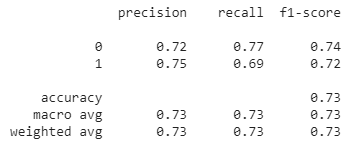
We are getting the best accuracy with random forest on cross-validation as ~73%.
Classification Report-
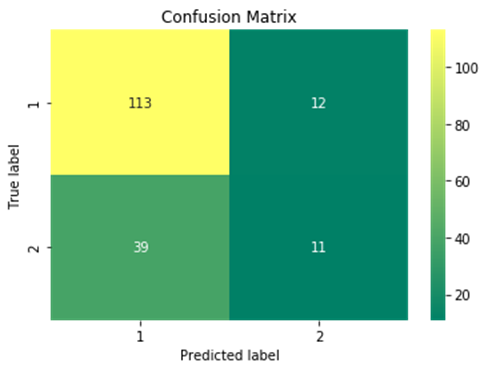
Confusion Matrix-
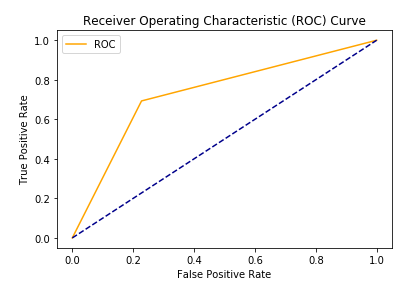
AUC – ROC curve:
AUC–ROC curve is the model selection metric for bi–multi-class classification problem. ROC is a probability curve for different classes. ROC tells us how good the model is for distinguishing the given classes, in terms of the predicted probability. A typical ROC curve has False Positive Rate (FPR) on the X-axis and True Positive Rate (TPR) on the Y-axis. The area covered by the curve is the area between the orange line (ROC) and the axis. This area covered is AUC. The bigger the area covered, the better the machine learning models is at distinguishing the given classes. The ideal value for AUC is 1.
Further Proceedings:
- The dataset contains
the details of diabetes liver details, and we can achieve better accuracy with
the help of CT images of livers to make better impact inaccuracy.
- As this dataset is so crucial and important in the science industry, there should be more contributors to the dataset, which leads in better ml model.
- With Image dataset of the liver, we can use various CNN, Inception V3 and other better algorithms to achieve better accuracy.
Why Guires
Guires Data analytics mission is to democratize AI for healthcare industries. The team of data science expert use the power of AI to solve business and social challenges. We are a pioneer in the research field for more than fifteen years and offer end to end solution for the firm to set the direction for the company and support analytical frameworks for better understanding and making strategic decisions. We provide appropriate solutions using your existing volume of data available in varying degree of complexities that cannot be processed using traditional technologies, processing methods, or any commercial off the shelf solutions. By outsourcing big data to us, we can analyze events that have happened within and outside an organization and correlate those to provide near accurate insights into what drove the outcome. Our big data analytics solutions are fast, scalable and possess flexible processing.
We use powerful algorithms, business rules, and statistical models. We work with text, image, audio, video and machine data. Our medical experts understand the different layers of data being integrated and what granularity levels of integration can be completed to create the holistic picture. Our team creates the foundational structure for analytics and visualization of the data. Our data analytics team is well equipped with advanced mathematical degrees, statisticians with multiple specialist degrees who can apply cutting-edge data mining techniques thereby enabling our clients to gain rich insights into existing customers and unearth high potential prospects.
How can you make the most of predictive analytics? Let us help you get started.
Get predictive analytics working for you. Contact Guires expert.
How can you make the most of predictive analytics? Let us help you get started.
Get predictive analytics working for you. Contact Guires expert.


Comment here