

The Challenges
Diabetic retinopathy, also known as diabetic eye disease, is a medical condition in which damage occurs to the retina due to diabetes mellitus. It is a leading cause of blindness. Diabetic retinopathy affects up to 80% of those who have had diabetes for 20 years or more. At least 90% of new cases could be reduced with proper treatment and monitoring of the eyes.The longer a person has diabetes, the higher his or her chances of developing diabetic retinopathy. Identifying people with risk of diabetic retinopathy is challenging.
Opportunity
In order to understand the predictive modeling, we built a machine learning model try to predict whether or not the patient is affected by diabetic retinopathy. The dataset contains features from Messidor image data set. All features represent a detected lesion, a descriptive feature of anatomical part or an image-level descriptor.
quality– The binary result of quality assessment. 0 = bad quality 1 = sufficient quality.Abn– The binary result of pre-screening, where 1 indicates severe retinal abnormality and 0 its lack.Ma1 – Ma6– The results of microaneurism detection. Each feature value stand for the number of microaneurisms found at the confidence levels alpha = 0.5, . . . , 1, respectively.Exu1 – Exu8– exudates are represented by a set of points rather than the number of pixels constructing the lesions, these features are normalized by dividing the number of lesions with the diameter of the ROI to compensate different image sizes.Euclidean– The Euclidean distance of the centre of the macula and the centre of the optic disc to provide important information regarding the patient’s condition. This feature is also normalized with the diameter of the ROI.Diameter– The diameter of the optic disc.amfm– The binary result of the AM/FM-based classification.Class– Class label. 1 = contains signs of Diabetic Retinopathy, 0 = no signs of Diabetic Retinopathy.- First five rows of data looks like this –
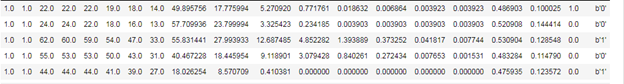
There are no null elements present in the dataset. Every feature in the dataset is numerical.
Let’s see the correlation between all the features to understand how close the features are –
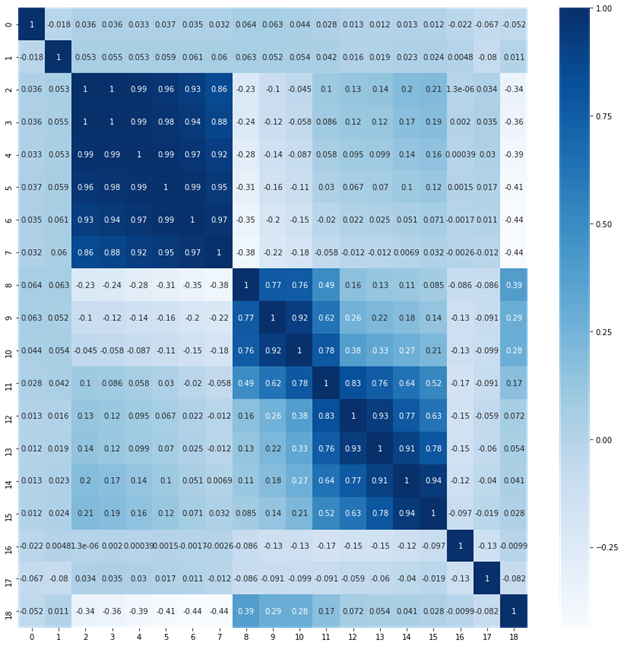
We can clearly see that the correlation between Ma1 to Ma 6 are close and Exu1-Exu8 are close to each other, then both ma’s and exu’s are correlated than the others. Features like- amfm, abn, quality do not correlate with any of the other features.
Standardisation: this is an important step before modelling as the features are needed to be in particular range. Consider this example, if feature age 50 and insulin 0.5 is fed into ML algorithm the machine thinks that age is more important as it has higher value. For this reason we need to normalize the dataset leaving out the target column. After completing this standardisation process the dataset looks like this-
We are doing this before visuals and modeling so that the features get normalize, this is achieved by using Standard scalar. Below are the few lines of normalized features –
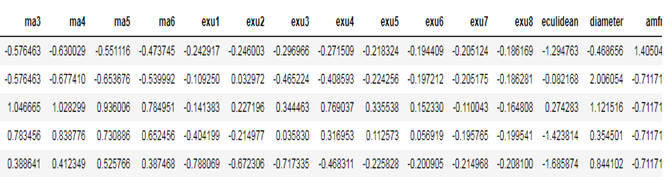
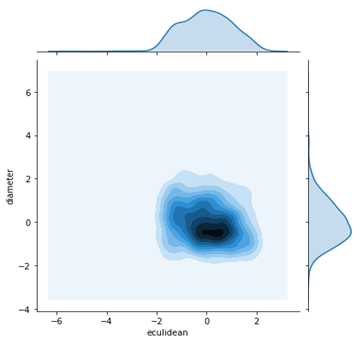
Features like Euclidean distance and Diameter of the optic disc seems like important features .
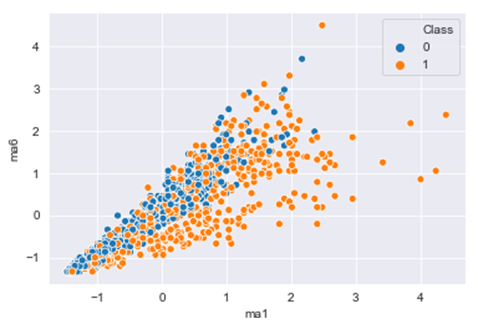
Features like Ma1 – Ma6 are numerical and have been normalized. These MicroAneurisms features are respectively dealt with the alpha rates, which start from 0.5 to 1 .
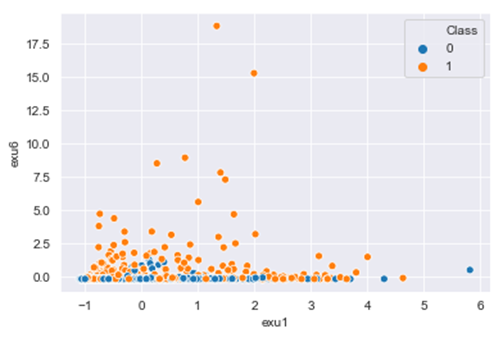
Features like EXu1 – Exu8 also have been normalized; they are represented by a set of points which represents lesions in the retina.
Principal Component Analysis: PCA is essentially a method that reduces the dimension of the feature space in such a way that new variables are orthogonal to each other (i.e. they are independent or not correlated). Here we are going to view the dataset with 2 principal components to see if we can split the dataset easily with basic ml algorithms.
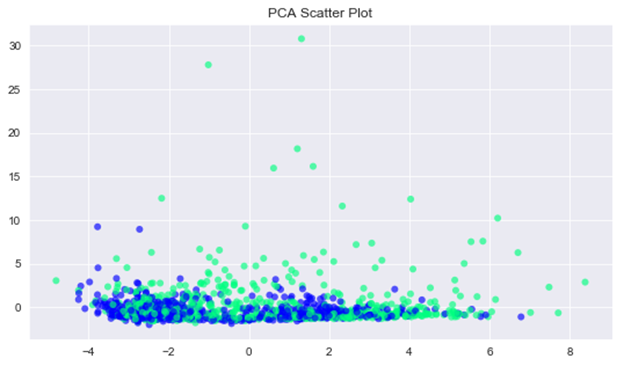
As the data points overlap, this might be difficult to separate linearly. Let us try to use various machine learning algorithms to predict diabetic retinopathy in a patient.
Predictive modelling:
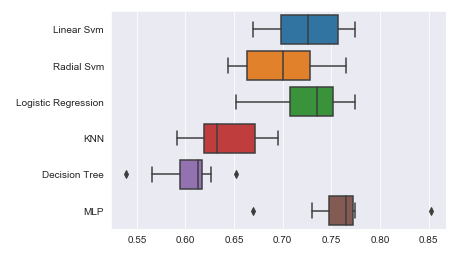
We will be using different machine learning algorithms such as SVM(Support Vector Machine), Logistic Regression , Random Forest classifier, Decision tree, KNN(K- Nearest Neighbours) and MLP(Multilayer Perceptron).
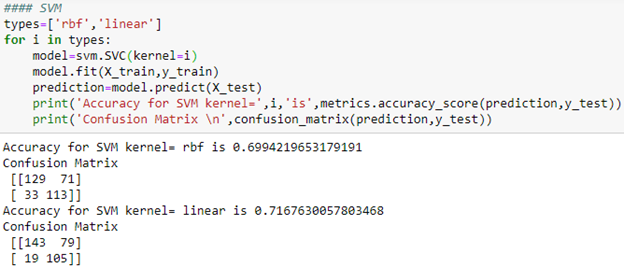
SVM: we will be using support vector machine from sklearn python package. There are two kernels in svm, namely Linear and rbf, and we will be testing both the algorithms.
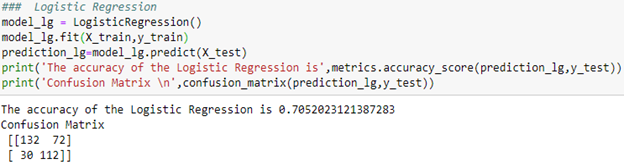
Logistic Regression: this algorithm is also from sklearn python package, here the main hyperparameters are C and Penalty(L1 or L2)
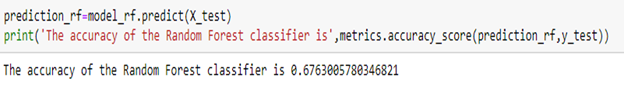
Random Forest: this algorithm is a type of ensemble model which works well for classification problems. Let us first find the important features and then predict diabetes.
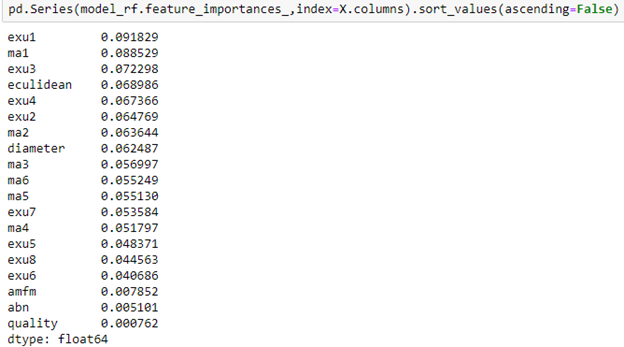
Features like amfm, abn and quality seem like the lowest of all and too low of importance shown than others. This might decide the outcome of the accuracy later, first we will try running with all the features.
KNN: K- nearest neighbour is a machine learning algorithm which uses distance metrics to find the closest neighbours of our features, we need to find the value of k to get the best accuracy at a particular value.
We will be testing with many numbers of k- neighbours so that we can find the best amount for k to achieve better accuracy.
For this dataset let’s set the value of k as 20.
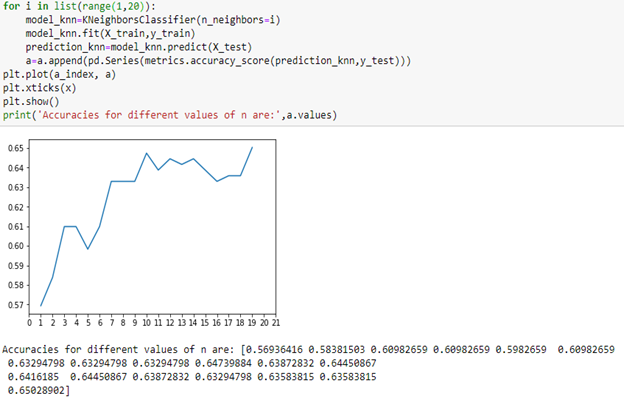
Accuracy does not seem to get higher than 66%, so we will stop with 20 nearest neighbours and 20 th value for k got 65%.
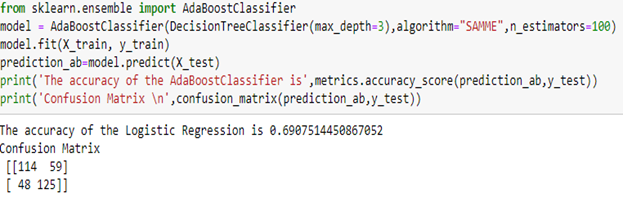
Adaboost classifier: Let us now try Ensemble model (which takes Decision tree classifier as its base algorithm and same hyperparameters as decision tree is set)
Next, we will be trying MULTI-LAYER PERCEPTRON -with different iteration of different layers and learning rate.
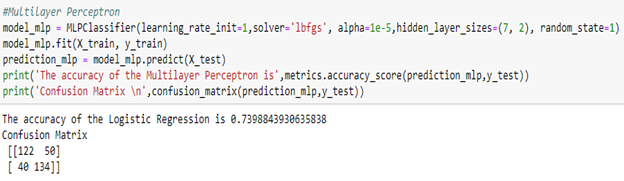
After a long trial of testing learning rate(0.1,0.01,0.001,0.0001), solver: adam, lgbfs, and choosing different layers , the best accuracy is got from –
Learning rate – 1
Solver – Lgbfs
Hidden layer size – 7
Random state – 1
We got an accuracy of 73%, which is better than most of the basic algorithms.
Cross-validation: Cross-validation is a resampling procedure used to evaluate machine learning models on a limited data sample.
The general procedure is as follows:
- Shuffle the dataset randomly.
- Split the dataset into k groups.
- For each unique group:
- Take the group as a holdout or test data set.
- Take the remaining groups as a training data set.
- Fit a model on the training set and evaluate it on the test set.
- Retain the evaluation score and discard the model.
- Summarize the skill of the model using the sample of model evaluation scores.
Now we will be using this cross-validation for our algorithms and check which gives us better accuracy – let K be 10
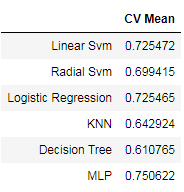
Multi-layer perceptron has done well in accuracy while using cross-validation with 75%.
Before we would have seen that some of the features are not so important than the others. These features are amfm , quality and abn, lets delete these out and test again with mlp model.

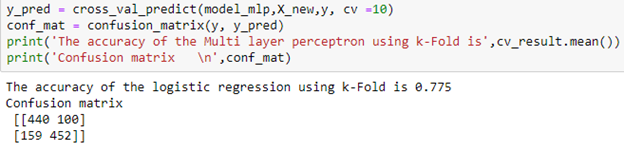
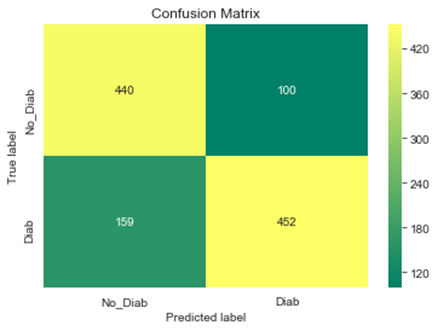
After training, we can see that this model with deleting unwanted features had improved a lot better than before with more than77% accuracy.
Classification report –
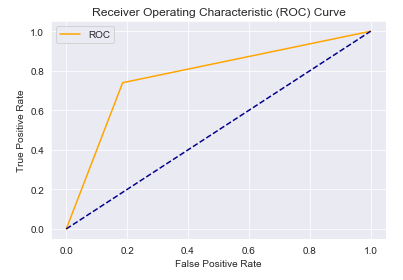
AUC – ROC curve:
AUC–ROC curve is the model selection metric for bi–multi-class classification problem. ROC is a probability curve for different classes. ROC tells us how good the model is for distinguishing the given classes, in terms of the predicted probability. A typical ROC curve has False Positive Rate (FPR) on the X-axis and True Positive Rate (TPR) on the Y-axis. The area covered by the curve is the area between the orange line (ROC) and the axis. This area covered is AUC. The bigger the area covered, the better the machine learning models is at distinguishing the given classes. The ideal value for AUC is 1.
Further Proceedings:
- The dataset contains the details of Messidor dataset image details, and
we can achieve better accuracy with the help of scanned images of retina to
make better impact inaccuracy.
- As this dataset is so crucial and important in the science industry, there should be more contributors to the dataset, which leads in better ml model.
- With Image dataset of Messidor, we can use various CNN, Inception V3 and other better algorithms to achieve better accuracy.
Why Guires
Guires Data analytics mission is to democratize AI for healthcare industries. The team of data science expert use the power of AI to solve business and social challenges. We are a pioneer in the research field for more than fifteen years and offer end to end solution for the firm to set the direction for the company and support analytical frameworks for better understanding and making strategic decisions. We provide appropriate solutions using your existing volume of data available in varying degree of complexities that cannot be processed using traditional technologies, processing methods, or any commercial off the shelf solutions. By outsourcing big data to us, we can analyze events that have happened within and outside an organization and correlate those to provide near accurate insights into what drove the outcome. Our big data analytics solutions are fast, scalable and possess flexible processing.
We use powerful algorithms, business rules, and statistical models. We work with text, image, audio, video and machine data. Our medical experts understand the different layers of data being integrated and what granularity levels of integration can be completed to create the holistic picture. Our team creates the foundational structure for analytics and visualization of the data. Our data analytics team is well equipped with advanced mathematical degrees, statisticians with multiple specialist degrees who can apply cutting-edge data mining techniques thereby enabling our clients to gain rich insights into existing customers and unearth high potential prospects.
How can you make the most of predictive analytics? Let us help you get started.
Get predictive analytics working for you. Contact Guires expert.


Comment here