
Explore a Use Case and Perspective
The Challenges
As the healthcare system moves toward value-based care, CMS has created many programs to improve the quality of care of patients. One of these programs is called the Hospital Readmission Reduction Program (HRRP), which reduces reimbursement to hospitals with above-average readmissions. For those hospitals which are currently penalized under this program, one solution is to create interventions to provide additional assistance to patients with increased risk of readmission. But how do we identify these patients? We can use predictive modelling from data science to help prioritize patients.
Opportunity
In order to understand the predictive modeling, we used the dataset from UCI machine learning repository and data consists of over 100000 hospital admissions from patients with diabetes from 130 US hospitals between 1999–2008. There are more than 50 features and 100K rows in this dataset. Some of the important features are:
- encounter_id and patient_nbr: these are numbers to specify each patient
- age and weight: these specify the age and weight of the patient.
- admission_type_id,discharge_disposition_id,admission_source_id: are numerical here, but are IDs. They are considered as categorical.
- diag1, diag2, diag3 — are categorical and have a lot of values. We will not use these as part of this project, but you could group these ICD codes to reduce the dimension. We will use number_diagnoses to capture some of this information.
- medical_speciality — has many categorical variables, so we should consider this when making features.
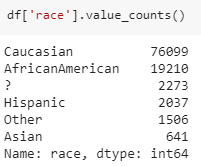
- Race – Race of the Patient.
There are more medical terms such as ‘metformin’, ‘repaglinide’, ‘nateglinide’, ‘chlorpropamide’,’glimepiride’, ‘acetohexamide’, ‘glipizide’, ‘glyburide’, ‘tolbutamide’,’pioglitazone’, ‘rosiglitazone’, ‘acarbose’, ‘miglitol’, ‘troglitazone’, ‘tolazamide’, ‘examide’, ‘citoglipton’. These all are YES or NO type of categorical variables. Our target variable here is >30 days, <30 days and No readmission days, but we will change this into a categorical variable (whether patient readmission happened or not).

Let’s look at the gender of the patient distribution in the dataset –

This shows us that more females are admitted than male patients and there are three unknown or invalid patient details. Race of a patient may not be the right feature in this modeling, as a race may not have a big impact and also it’s a categorical variable.
There is question mark symbol in most of our features, which actually means that there is no information about that feature for particular person or the feature has a NULL value. Let us look how many of these cases are present in the dataset.
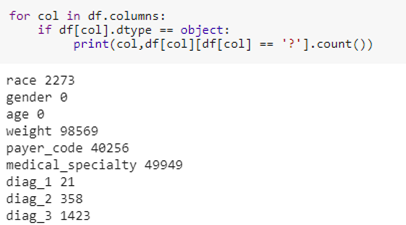
Since many of the features had missing values, – Weight, Payer_code and medical speciality, we dropped those features from our dataset.

We will drop rows which don’t contain diag1, diag2, diag3 in it. these diag variable seems to be more important.

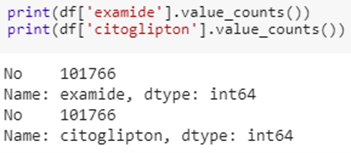
There are two features which have only one value in it, so we will drop those feature because that feature is not important as it is same for every patient.
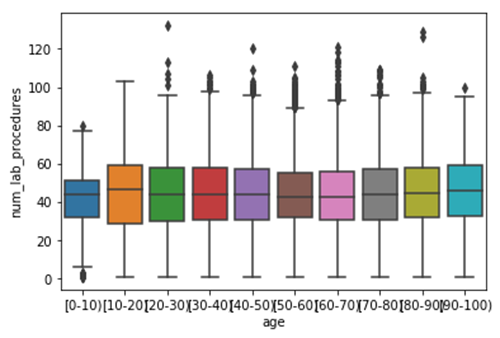
We compared age feature with the number of lab procedures done on that patient. In this case we found that the number of lab procedures done on a patient with age limit 0-10 has less number than others with an average of over 40. Others had more than 100 number of lab procedures done on them, mostly in the age group 60-70 and 20-30 years.
Let’s now compare these with gender, so that we can understand what goes on in this dataset.
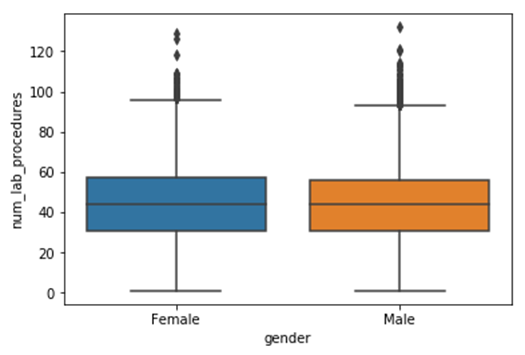
We can clearly see that there is no significant difference between male and female in terms of lab procedures. However, we applied correlation to we view the closeness of the features.

The above figure shows that majority of the features are not that correlated with each other except the number of medications and number of lab procedures showed high correlation. However, we are interested in number of medications with the race of the patient. The below figure presents the trend.

Here, we can see that there is gradual increase in the distribution of the number of medications, and this perhaps due to money-related issues or less affordable to buy medicines, especially Asian or Hispanics.
Standardisation: This is an important step before modelling as the features are needed to be in particular range. Consider this example, if feature age 50 and insulin 0.5 is fed into ML algorithm the machine thinks that age is more important as it has higher value. For this reason, we need to normalize the dataset leaving out the target column. After completing this standardisation process, the dataset looks like this- We are doing this before visuals and modelling so that the features get normalize, this is achieved by using Standard scalar. Below are the few lines of normalized features –

Modelling: We will be using different machine learning algorithms such as SVM(Support Vector Machine), Logistic Regression , Random Forest classifier, Decision tree, KNN(K- Nearest Neighbours) and MLP(Multilayer Perceptron),XG Boost classifier, and SGD classifier.
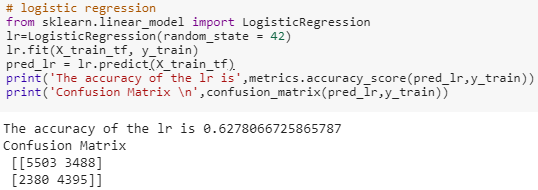
Logistic Regression: this algorithm is also from sklearn python package, here the main hyperparameters are C and Penalty (L1 or L2).
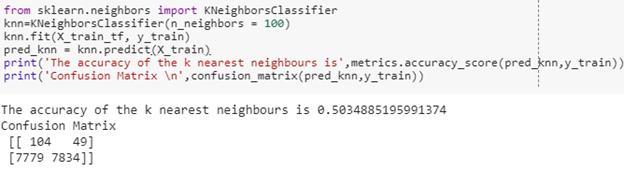
KNN: K- nearest neighbour is a machine learning algorithm which uses distance metrics to find the closest neighbours of our features, we need to find the value of k to get the best accuracy at a particular value. We will be testing with many numbers of k- neighbours, so that we can find the best amount for k to achieve better accuracy.
Decision Tree: decision tree classifier is used here, and we import this classifier from sklearn package.
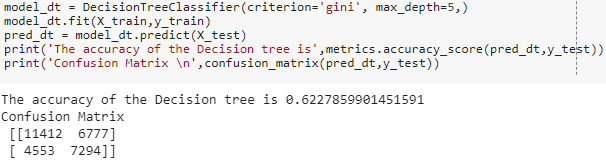
The accuracy of decision tree is lower than other models.
Random Forest: this algorithm is a type of ensemble model which works well for classification problems. Let us first find the important features and then predict the readmission of patients.

SGD Classifier: SGD Classifier implements regularised linear models with Stochastic Gradient Descent. Stochastic gradient descent considers only 1 random point while changing weights, unlike gradient descent which considers the whole training data.

XGboost: Gradient boosting is a machine learning technique for regression and classification problems, which produces a prediction model in the form of an ensemble of weak prediction models, typically decision trees.

We got better accuracy than any others using Gradient boosting algorithm with mostly 70% accuracy. Now let’s try Grid Search CV for other models and set correct parameters to achieve better accuracy.
Decision Tree Hyperparameter Tuning:
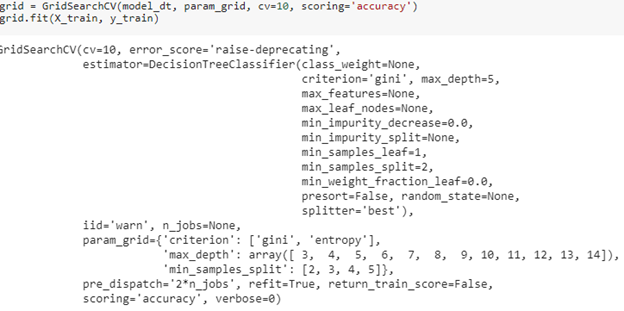
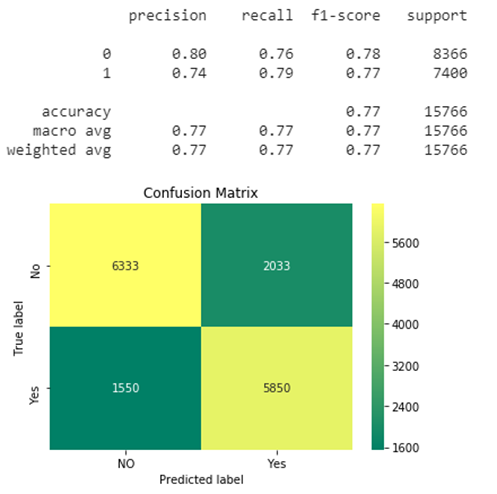
Our best accuracy looks like this with 77% Accuracy. Let’s plot the Classification report and Roc curve:
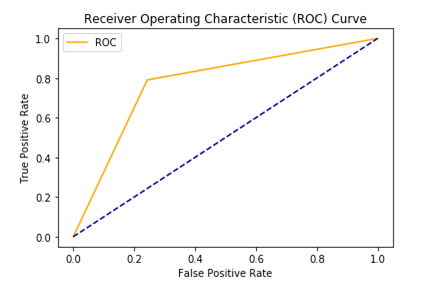
AUC – ROC curve: AUC–ROC curve is the model selection metric for bi–multi-class classification problem. ROC is a probability curve for different classes. ROC tells us how good the model is for distinguishing the given classes, in terms of the predicted probability. A typical ROC curve has False Positive Rate (FPR) on the X-axis and True Positive Rate (TPR) on the Y-axis. The area covered by the curve is the area between the orange line (ROC) and the axis. This area covered is AUC. The bigger the area covered, the better the machine learning models is at distinguishing the given classes. The ideal value for AUC is 1.
Further proceedings: We had used 50 features to understand the features linked with admission. However, in future we can reduce this in the final analyses. Further neural networks should be used to achieve better accuracy, and we can reduce the dataset size as it takes lot time while running Grid Search CV.
Why Guires
Guires Data analytics mission is to democratize AI for healthcare industries. The team of data science expert use the power of AI to solve business and social challenges.
How can you make the most of predictive analytics? Let us help you get started.
Get predictive analytics working for you. Contact Guires expert.


Comment here