
The Challenges
Diabetes is a group of metabolic disorders in which there are high blood sugar levels over a prolonged period. Symptoms of high blood sugar include frequent urination, increased thirst, and increased hunger. If left untreated, diabetes can cause many complications. Acute complications can include diabetic ketoacidosis, hyperosmolar hyperglycemic state, or death. Serious long-term complications include cardiovascular disease, stroke, chronic kidney disease, foot ulcers, and damage to the eyes.
Opportunity
In order to understand predictive modelling, we tried to build a machine learning model to accurately predict whether or not the patients in the dataset have diabetes or not. The datasets consist of several medical predictor variables and one target variable, Outcome. Predictor variables includes the number of pregnancies the patient has had, their BMI, insulin level, age, and so on.
- Pregnancies: Number of times pregnant
- Glucose: Plasma glucose concentration 2 hours in an oral glucose tolerance test
- blood pressure: Diastolic blood pressure (mm Hg)
- SkinThickness: Triceps skinfold thickness (mm)
- Insulin: 2-Hour serum insulin (mu U/ml)
- BMI: Body mass index (weight in kg/(height in m)^2)
- DiabetesPedigreeFunction: Diabetes pedigree function
- Age: Age (years)
- Outcome: Class variable (0 or 1)
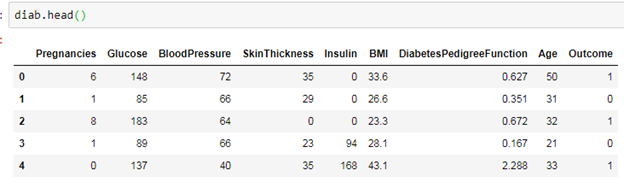
First five rows of the dataset look like this –
DataFrame.describe() method generates descriptive statistics that summarize the central tendency, dispersion and shape of a dataset’s distribution, excluding NaN values. This method tells us a lot of things about a dataset.
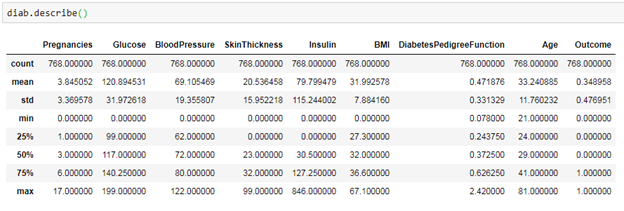
A question which arises here is –
Can the minimum value of below-listed columns be zero (0)?
On these columns, a value of zero does not make sense and thus indicates a missing value. Following columns or variables have an invalid zero value:
- Glucose
- blood pressure
- skin thickness
- Insulin
- BMI
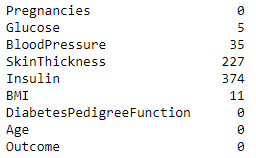
So we can say that the zero elements might be the null values in the dataset. Let’s find out the Total null values in the dataset with respect to each feature.
We need to figure out how to impute these NaN values so that we can use them in modelling. There are many ways to impute NaN values in the dataset, such as
- Filling in median values of the features
- Filling in the mean value of the total feature
- Removing the feature column (if more than 70% of feature is null)
Here, to find out which way to do, we can use hist from matplotlib to know how the data is spread for a particular feature.

We will be imputing NaN values for the columns in accordance with their distributions. Glucose feature will use mean of the column as it is normally distributed, Insulin is skewed towards left and does have more values from 0-100, so we will use median on it, same for BMI and Skin thickness features and at last for blood pressure we will use mean on it.
The results are –

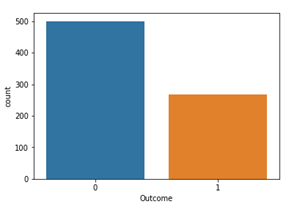
Let us see our outcome feature (this is our target variable) –
Now let us see the Correlation between each variable to analyse our data well, we are using a seaborn package to get this correlation.
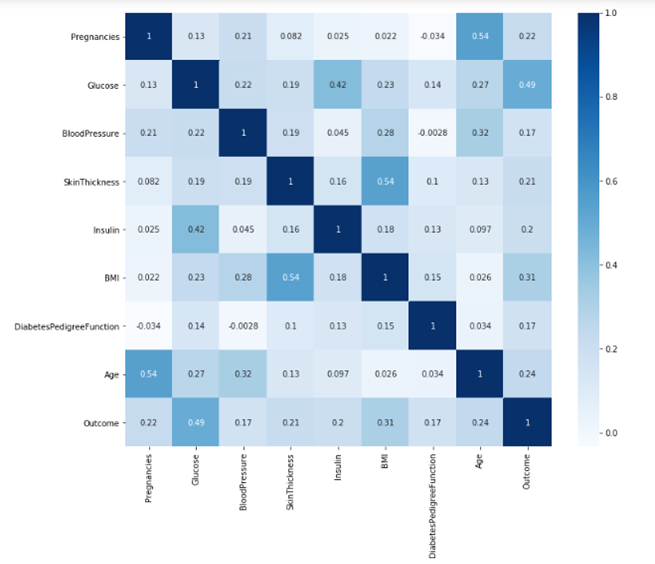
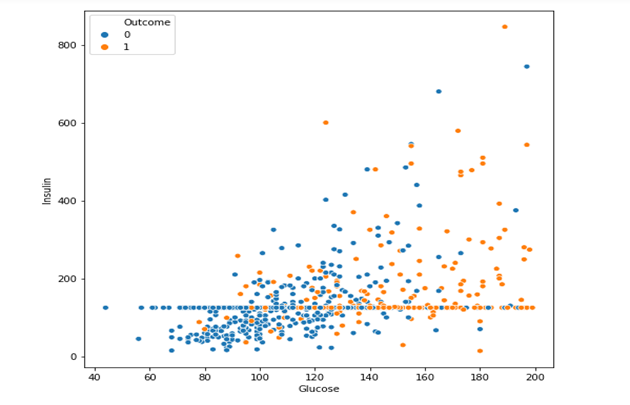
Glucose and Insulin are the important features which might have a huge impact on the target variable (Outcome).
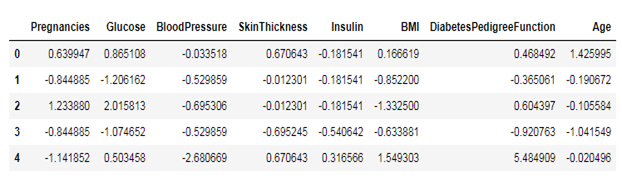
Standardisation: this is an important step before modelling as the features are needed to be in a particular range. Consider this example, if feature age 50 and insulin 0.5 is fed into ML algorithm the machine thinks that age is more important as it has higher value. For this reason, there is a need to normalize the dataset leaving out the target column. After completing this standardisation process the dataset looks like this-
Predictive modelling:
We will be using different machine learning algorithms, ensemble modelling, cross-validation(K-fold) to find out better accuracy for predicting if a person has Diabetes or not.
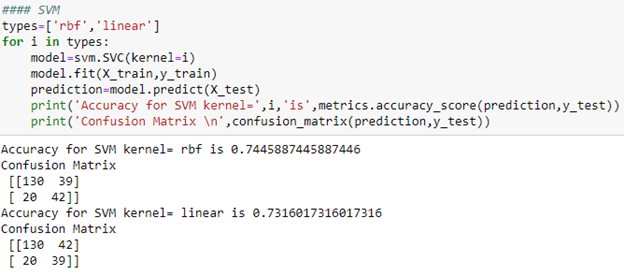
SVM: we will be using support vector machine from sklearn python package. There are two kernels in svm namely Linear and rbf, and we will be testing both the algorithms.
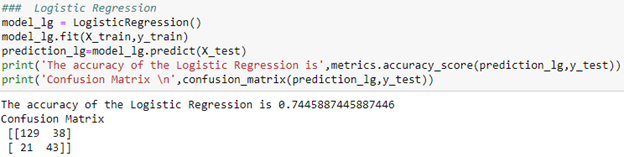
Logistic Regression: this algorithm is also from sklearn python package, here the main hyperparameters are C and Penalty(L1 or L2)
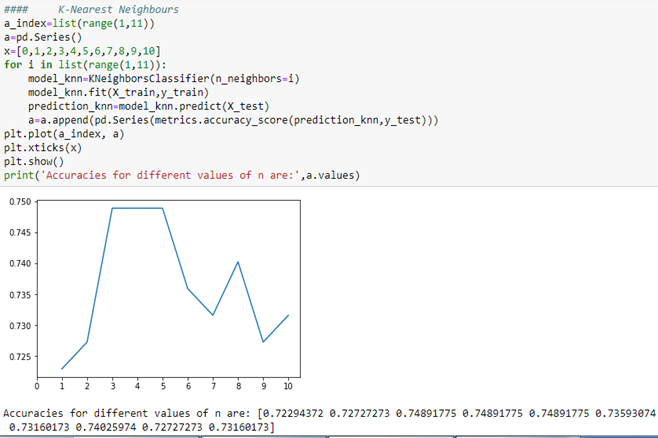
KNN: K- nearest neighbour is a machine learning algorithm which uses distance metrics to find the closest neighbours of our features, we need to find the value of k to get the best accuracy at a particular value.
Random Forest: this algorithm is a type of ensemble model which works well for classification problems. Let us first find the important features and then predict the outcome. These are the feature importance of our dataset –

Here we can see that Glucose is the most important feature in the dataset if the Glucose level increases or Decreases then there is a huge possibility of getting Diabetes.
Accuracy:

Cross-validation: Cross-validation is a resampling procedure used to evaluate machine learning models on a limited data sample.
The general procedure is as follows:
- Shuffle the dataset randomly.
- Split the dataset into k groups.
- For each unique group:
- Take the group as a holdout or test data set.
- Take the remaining groups as a training data set.
- Fit a model on the training set and evaluate it on the test set.
- Retain the evaluation score and discard the model.
- Summarize the skill of the model using the sample of model evaluation scores.
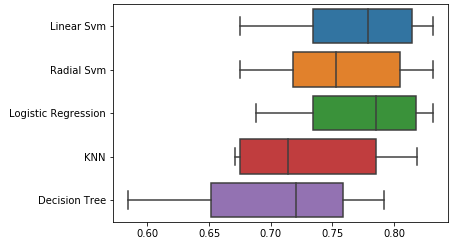
Now we will be using this cross validation for our algorithms and check which gives us better accuracy – let K be 10
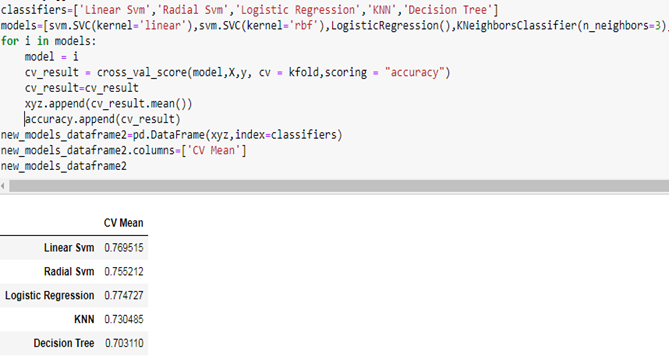
We can infer that the best accuracy for this model was from k-fold(Logistic regression) with 77.5%
Ensemble modelling: we will be using Voting classifier in ensemble modeling , the two algorithms which got high accuracy before will be used in this – Linear SVM and Logistic Regression.
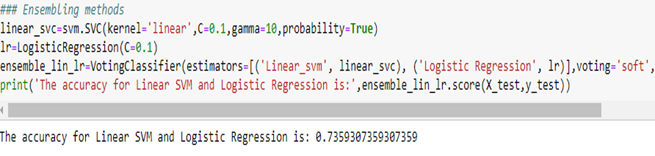
While using ensemble model, we couldn’t get much better accuracy than single classifier, so this method will not be used further.
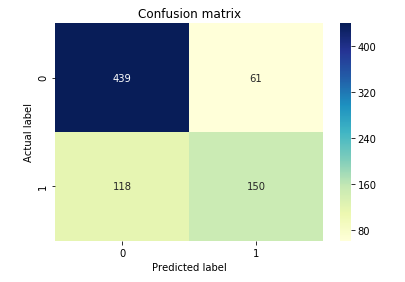
Best model:
As we have tried all the algorithms and method that we have mentioned above , best accuracy is got from Logistic Regression using K-Fold cross-validation.

TP : 439 ; TN : 150 ; FP : 61 ; FN : 118 ;
AUC – ROC curve:
AUC–ROC curve is the model selection metric for bi–multi-class classification problem. ROC is a probability curve for different classes. ROC tells us how good the model is for distinguishing the given classes, in terms of the predicted probability. A typical ROC curve has False Positive Rate (FPR) on the X-axis and True Positive Rate (TPR) on the Y-axis. The area covered by the curve is the area between the orange line (ROC) and the axis. This area covered is AUC. The bigger the area covered, the better the machine learning models is at distinguishing the given classes. Ideal value for AUC is 1.

Further proceedings:
- This dataset is small
and did not capture features well. Therefore, there is a need for more data in
order to train the model to gain rich insights on the features.
- We can add few more features which can be useful in predictions, new features should be added with consent of Doctors which actually affects the outcome accurately.
Why Guires
Guires Data analytics mission is to democratize AI for healthcare industries. The team of data science expert use the power of AI to solve business and social challenges. We are a pioneer in the research field for more than fifteen years and offer end to end solution for the firm to set the direction for the company and support analytical frameworks for better understanding and making strategic decisions. We provide appropriate solutions using your existing volume of data available in varying degree of complexities that cannot be processed using traditional technologies, processing methods, or any commercial off the shelf solutions. By outsourcing big data to us, we can analyze events that have happened within and outside an organization and correlate those to provide near accurate insights into what drove the outcome. Our big data analytics solutions are fast, scalable and possess flexible processing.
We use powerful algorithms, business rules, and statistical models. We work with text, image, audio, video and machine data. Our medical experts understand the different layers of data being integrated and what granularity levels of integration can be completed to create the holistic picture. Our team creates the foundational structure for analytics and visualization of the data. Our data analytics team is well equipped with advanced mathematical degrees, statisticians with multiple specialist degrees who can apply cutting-edge data mining techniques thereby enabling our clients to gain rich insights into existing customers and unearth high potential prospects.
How can you make the most of predictive analytics? Let us help you get started.
Get predictive analytics working for you. Contact Guires expert.
How can you make the most of predictive analytics? Let us help you get started.
Get predictive analytics working for you. Contact Guires expert.


Comment here